Visualizing Dash models
Zhu Haoyuan
Supervisor: Qian Chenxiong
Abstract models represent properties and behaviors of systems, and are widely used to validate correctness of system designs and eliminate bugs during development stages.
Alloy is a popular lightweight modelling language that describes models by defining objects, relations, and constraints. However, it is often complicated to describe behavior models with Alloy.
Thus, Dash was developed by the WatForms group to extend Alloy in the aspect of modelling abstract behavior models. It offers easy syntax to define a behavior model through specifying states, events, and transitions. It is also closely integrated with statecharts, a common and standard approach of visually representing states and transitions of systems.
Despite its advantages in describing models, Dash is rather underdeveloped when it comes to interacting with written models. To address the lack of response and interaction to Dash models, this project proposes to develop visualizations for them.
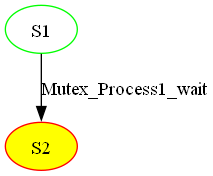
This project aims to visualize written Dash models in an automated manner. The proposed visualization consists of two graphs: a snapshot tree and a state graph.


Apart from generating visualizations of models, this project also contains other aspects. Namely, integration and testing. This project proposes to integrate the visualizing functionalities inside the Alloy Debugger (ALDB) since it is the tool for debugging and running simulations of Dash models. Possible integration tasks will involve implementing new functions and classes inside it. Lastly, this project proposes to conduct unit tests to ensure the overall functionalities of ALDB and new visualizing components.
- October 1st, 2024: Prior research completed, deployed Dash and ALDB locally for development purposes, formulate feasible project plan and methodology, and present a detailed project plan.
- December 1st, 2024: Implement the main visualizing function (produce .png outputs from extracted model information). Generate demos and case studies for the first presentation.
- Jan 10th, 2025: Implement an interactive GUI that displays the visualizations from the generated layout information.
- March 1st, 2025: Integrate GUI components with ALDB commands and functionalities,
- March 20th, 2025: Update ALDB unit tests and run them to ensure correctness of the project code.
- April 20th, 2025: Finalize project, produce final report and presentation.